OpenData.swiss Tags Network
Posted on 2023-10-01 in opendata
Links
Create Graph
The network itself is created with Gephi. I get the data from my daily snapshots of CKAN packages from opendata.swiss. Packages and resources can be downloaded in daily exports from files.bardos.dev. You can also collect the currently available packages from the CKAN API.
Collect Data
Data is collected and exported to CSV via a custom script. The data is then used inside Gephi to generate the network graph.
Gephi
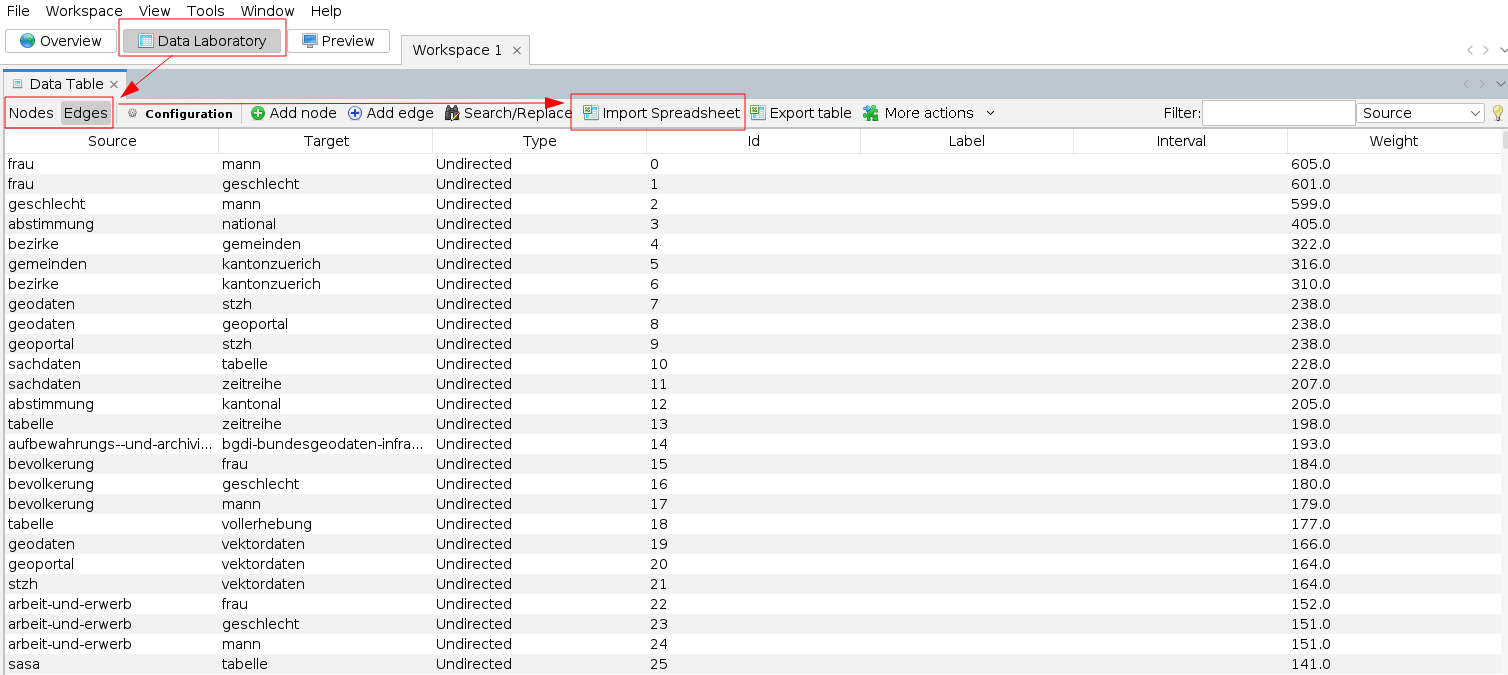
Nodes/Edges
Inside Gephi, I first imported the two separte CSVs for the edges and nodes (both undirected).
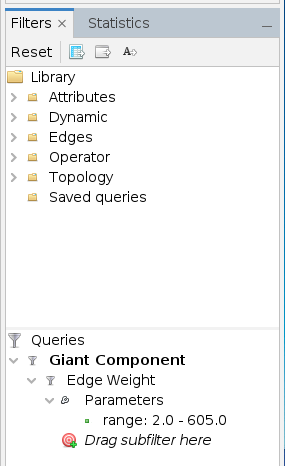
Filters
Then, I set the filters. Because of the huge amount of Edges (around 50k), I only select edges which are mentioned at least in two CKAN packages. Additionally, I want only one network. Nodes detached from the main network get filtered out.
- Remaining Nodes: 2109
- Remaining Edges: 14622
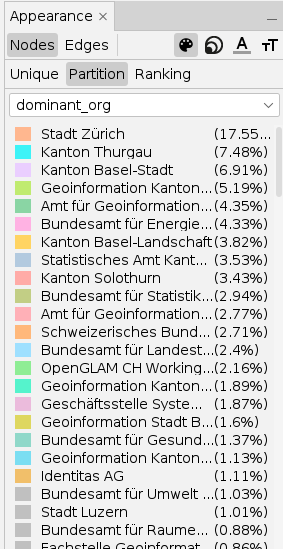
Apearance
In order to create a nice looking network, I set the following options for the nodes:
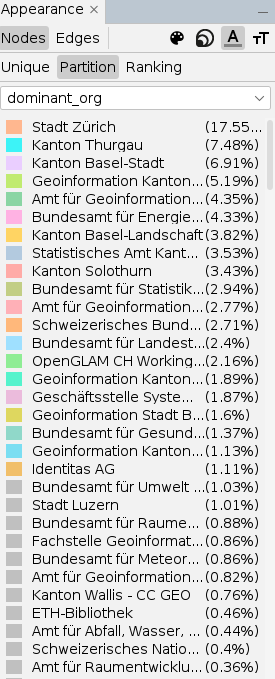
Nodes Color
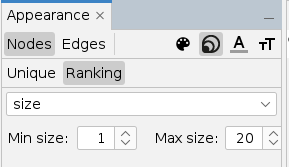
Nodes Size
Nodes Label Color
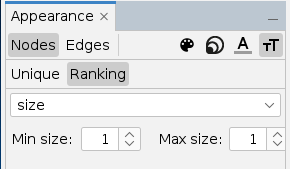
Nodes Label Size
Generate Network
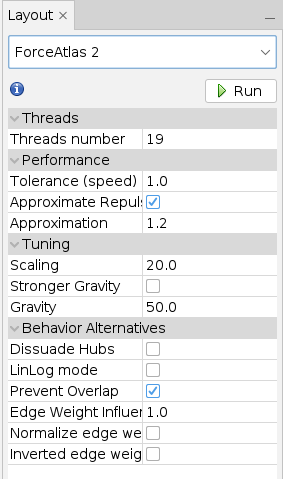
I was using Force Atlas 2 to generate the network with the following config:
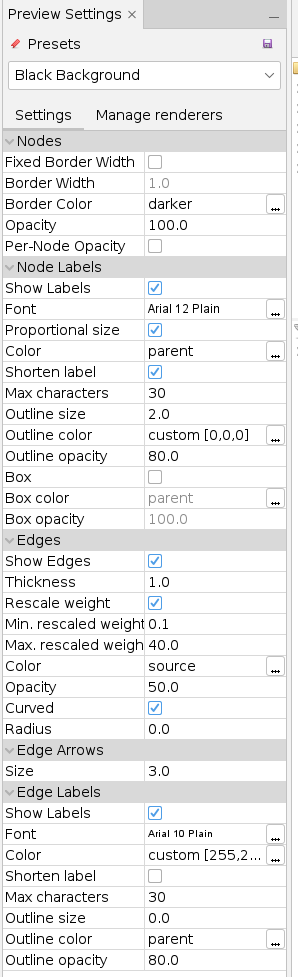
Style Preview
Then, I generated the preview with the following config:
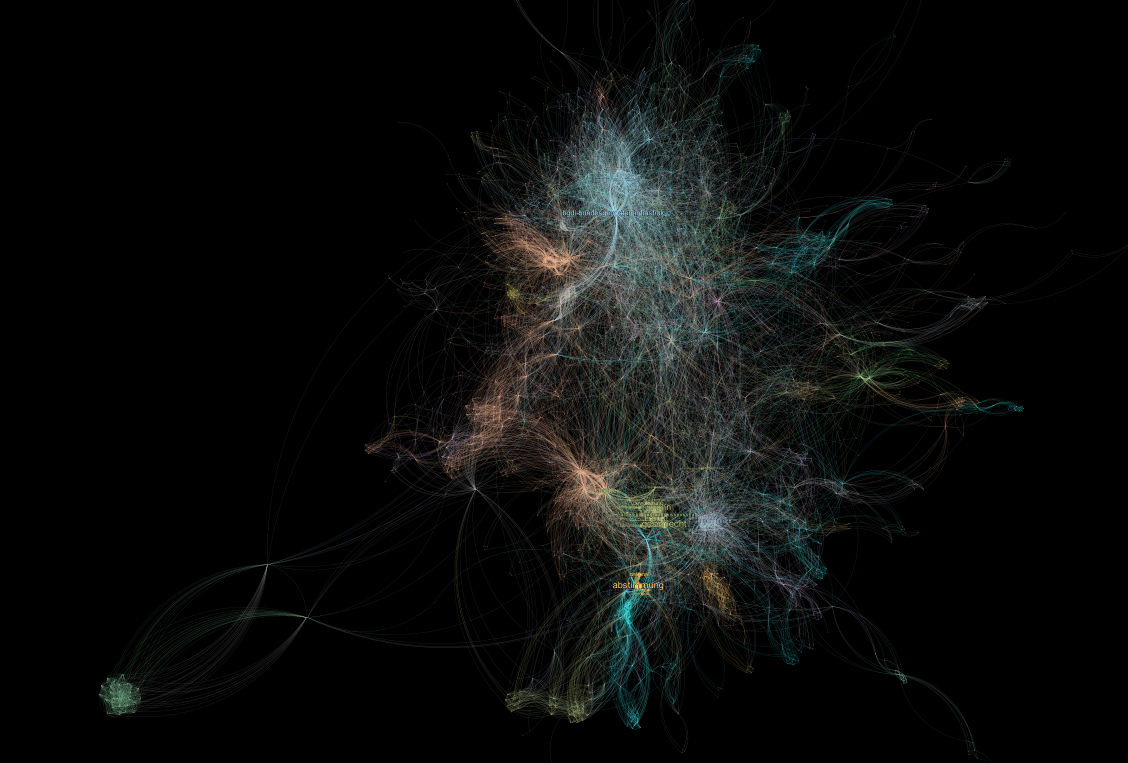
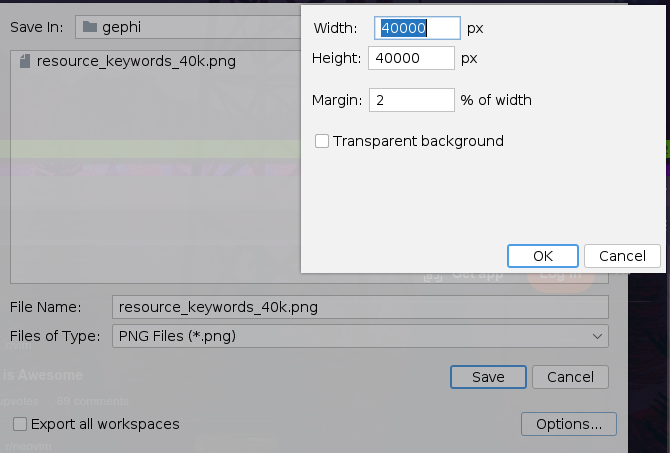
The preview gets then exported to a PNG:
Create Custom Tiles
When the image is exported, it's too large to display as a single image. Therefore, the images gets chopped into tiles, which can be later picked up by folium.
For this, I use gdal2tiles with the following command:
python gdal2tiles-multiprocess.py -l -p raster -z 0-9 -w none --processes=10 <path to png> <destination folder>
When done, the directory gets pushed to Github where the tiles can get called e.g. from Folium.